I wrote back in February that raising corporation tax to 25% could take the effective rate of tax to the highest it’s ever been in the UK. We now have more data, and can say with some confidence that UK companies will indeed pay more tax in 2023, as a percentage of their profits, than at any time since the 1970s, and plausibly than at any time since 1946.
The Johnson government increased corporation tax from 19% to 25% from April 2023. The mini-Budget reversed this. Then Jeremy Hunt’s Autumn Statement reversed the reversal, taking the rate back to 25% from April. How should we assess the merits of the increase to 25%?, almost one year later? Should we reverse the reversal of the reversal?
The standard argument for the increase goes something like this:
“We’ve been cutting corporate tax for 25 years, it’s gone too far, and it’s time to go back to 25%. After all, the rate was 33% in the 80s, and is now 19%, so 25% is still a pretty good deal.”
That argument is usually accompanied by this chart, showing the headline rate falling dramatically:
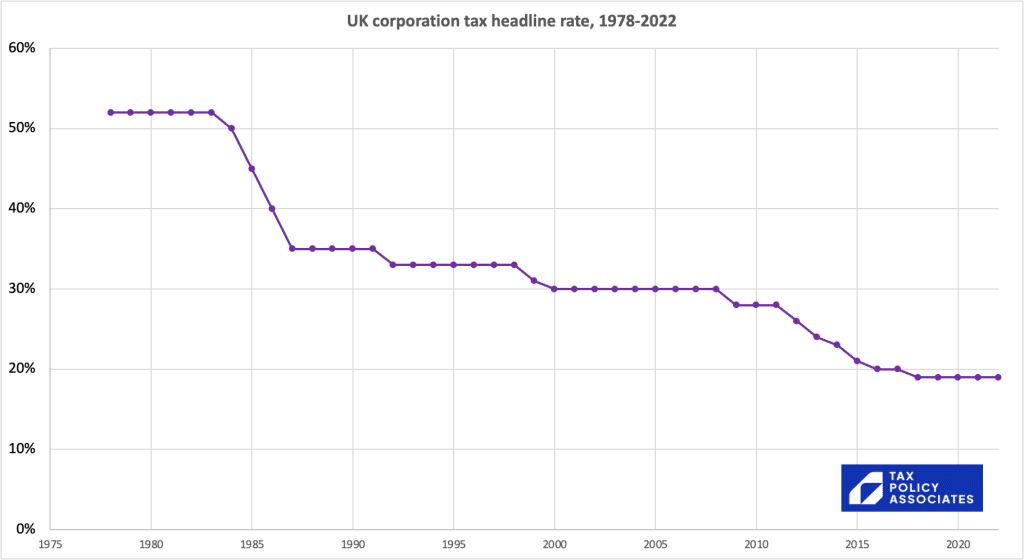
But nobody pays the headline rate. They pay their “taxable profits” (often called the “base”) multiplied by the headline rate. And what that chart doesn’t show is the change in the definition of “taxable profits”. It’s half the story – some would say much less than half.
We get more of a clue of what’s going on if we look at the corporate tax actually paid – here’s an overlay showing UK corporation tax receipts (in red) as a % of GDP:1GDP data from the OECD tax database.
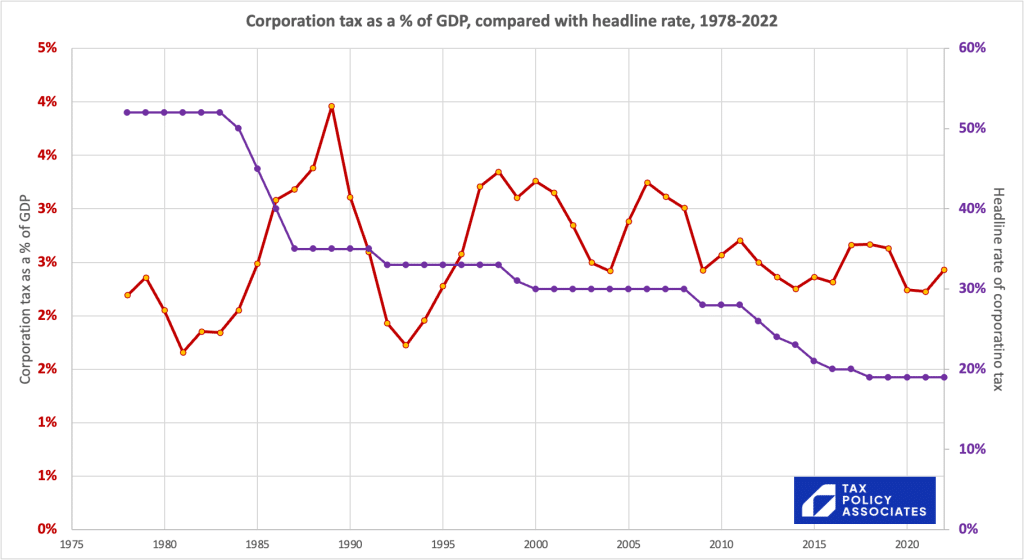
The rate fell. The revenues bounced around with the business cycle, but fundamentally didn’t change much, if at all – there’s no statistically significant pattern here2p=0.54.
Could it just be that corporate profits rose, so the declining rate multiplied by increased profits kept revenues broadly constant? We can test that by dividing corporation tax revenues by the corporate “gross operating surplus” in the national accounts,3Source for GOS of all corporations is ONS data here, for GOS of oil/gas is ONS data here, historic CT data from the IFS and most recent data from HMRC here excluding oil and gas on both sides of the equation. 4This is for two reasons: it is taxed differently, the oil/gas price is subject to significant fluctuations, and the tax regime has changed frequently – if therefore doesn’t tell us anything about normal corporate tax. I’ve also excluded the energy profits levy for the same reason. I’ve included the bank surcharge, because it’s just a higher rate of corporation tax for banks. I’ve excluded the bank levy, because it’s not a tax on profit. I’ve also excluded the residential property developer tax, largely because I’m unfamiliar with the detail – however the numbers are small (£157m in 2022) This gives us a reasonable proxy for the overall effective tax rate on corporates:5One big caveat: GOS is not the same as accounting profit, and in particular excludes depreciation (so the accounting profit will (all things being equal) be lower and the chart therefore understates ETR). So the trend is a useful indicator, but that absolute number cannot be compared with actual tax rates. Note that ONS CT receipts data now takes account of the time-lag between economic activity and tax payment (which has changed several times).
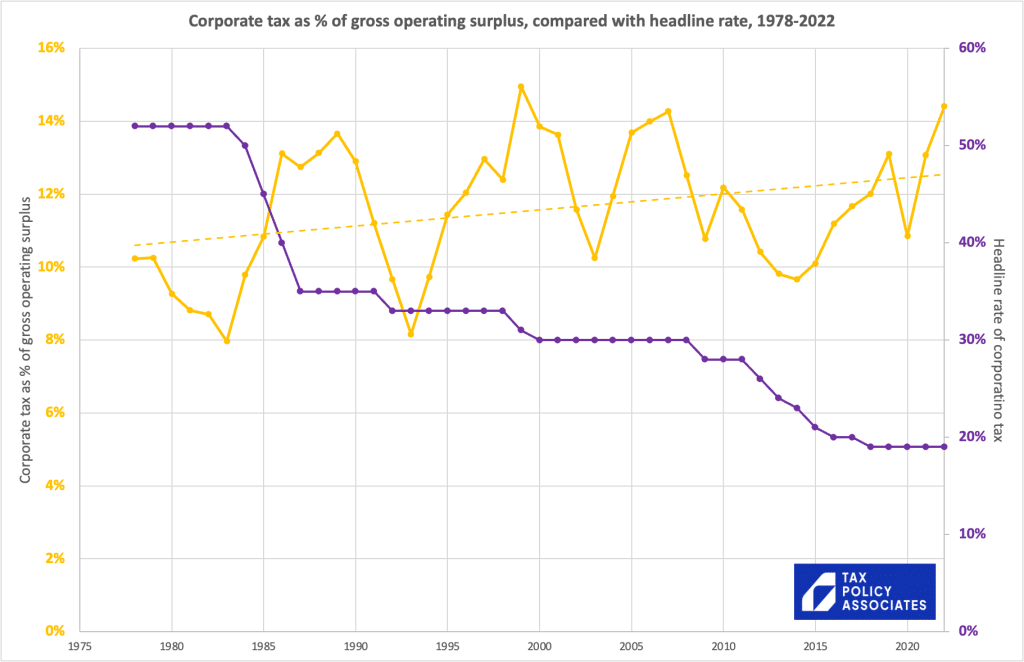
Now we do see a trend, but it’s the opposite of what we might expect. The plummeting headline rate didn’t reduce the actual effective rate (the yellow line); in fact there was a slight, but statistically significant, increase (p=0.03). How can the corporate tax take increase when the rate has fallen so dramatically?
The answer isn’t “Laffer Curve” – there is no sign of any correlation between rate cuts and increases in profitability.6Another factor we can dismiss is the wave of incorporation by small businesses. That artificially inflated corporation tax revenues, but at the cost of (greater) reductions in income tax. The effect, however, is too small to impact the trends visible in the charts above, being around £1bn (there was a much larger reduction in income tax revenues, because people were essentially avoiding income tax and opting into a significantly smaller amount of corporation tax). That pushed the apparent ETR up by approximately 0.2% – not material. It’s that the base – that definition of “taxable profits” – expanded dramatically.7 Some of this was the crackdown on avoidance, but technical changes were more significant, particularly the abolition of industrial buildings allowance So, through accident or brilliant HM Treasury design, nothing much changed.8Another hypothesis that’s often suggested is that what’s been happening is profit-shifting by corporations outside the UK, so that GOS has disappeared from the national accounts. Hence, whilst that profit then isn’t (much) taxed, it doesn’t impact on this chart. Only the mugs that have stayed behind are paying the high rate. This is absolutely a real effect, albeit that real and forthcoming changes make it more difficult. However the evidence is that the UK is a net beneficiary of profit-shifting, so this effect does not explain the trend in the chart.
The rate increase to 25% is, by contrast, accompanied by very little9We do have “full expensing” – enhanced relief for investment. There are good grounds to believe that permanent full expensing would materially boost investment; however this is a short term measure that is unlikely to have such effects. Most likely it functions (in essence) as a tax reduction for businesses making investments that were already planned before the policy was announced. It does therefore somewhat reduce the tax base. I missed this point in the original draft of this article – thanks to Chris Giles for spotting my error that narrows the tax base. We haven’t gone back to where things were last time the rate was 25% – we are in new territory, where companies pay significantly more tax for each % of the rate.
That means that, if we project forward to 2023, the chart looks like this:10This is a simple projection which assumes the 2022 GOS nominal figures go up with inflation (which itself won’t change the ETR), and then adds in the effect of the increased rate: in other words, increasing the overall onshore CT take by 25/19, leaving offshore CT untouched, and reducing the bank surcharge to 3/8ths of where it was. It deducts the HMT projected cost of “full expensing” (from page 77 of the Budget Red Book. I make no attempt to take account of dynamic effects, but I’m unconvinced anyone really knows what those will be.
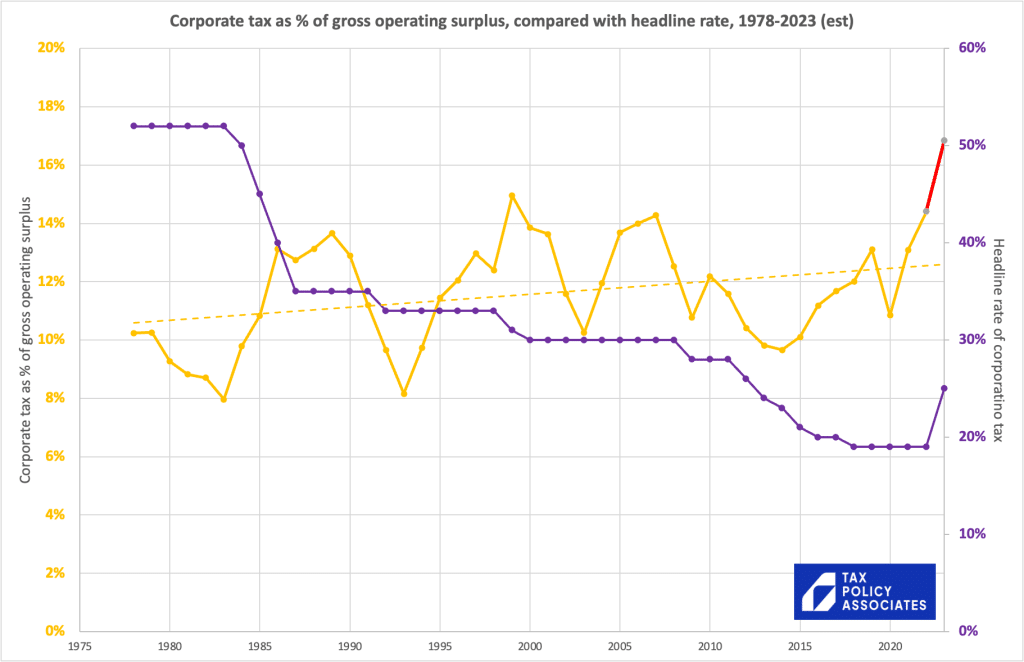
This is easily the highest effective rate of tax UK companies have paid since the 1970s – it’s not even close. It would be even higher if we focussed on large companies (as small companies pay a lower rate and get more reliefs).
I haven’t been able to find comparable CT data for earlier periods, but I’d be reasonably confident the ETR is now the highest since the WW2 excess profits tax was abolished in 1946. The tax system is much, much, “tighter” than it was in previous decades, and so (counter-intuitively) companies pay much more tax at 25% today than they did at 52% in the 1970s.
For completeness, here’s how the UK rate compares to everyone else:
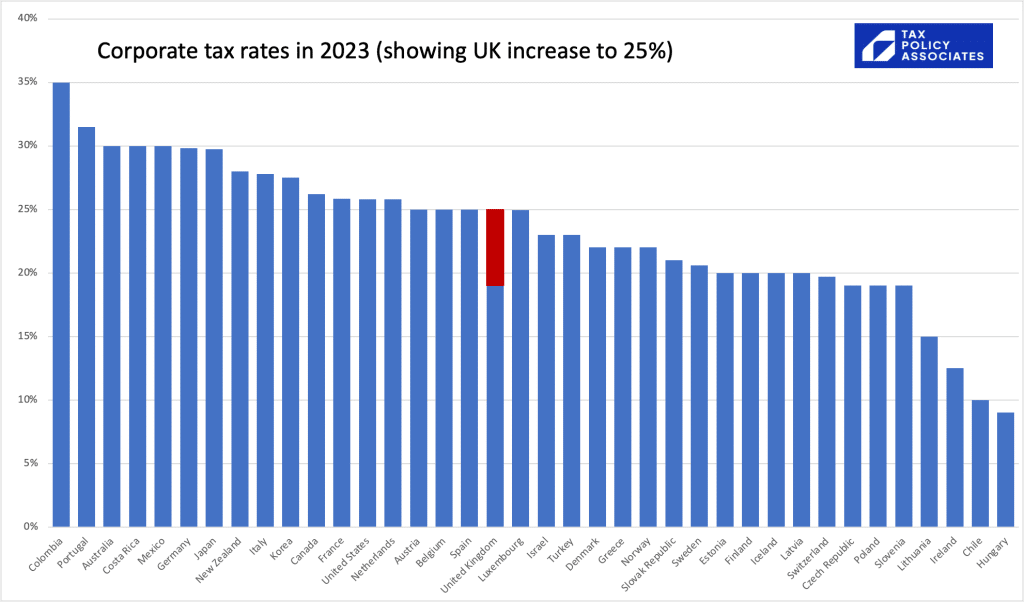
Or we can reorder it to see where the UK would have been if the rate had stayed 19%:

I am fundamentally a small C conservative when it comes to tax, and I worry about the effect of dramatic changes. I, therefore, remain convinced that raising corporate tax to this unprecedented level is a bad idea.
The problem, however, is that the 25% increase has been “banked” in government accounts. The Kwarteng cancellation of the increase in the mini-Budget was unfunded, meaning that the £16bn+ the cancellation cost would have been distributed opaquely throughout society through inflation and/or higher interest rates. I don’t regard that as good tax policy.
Alternatively, we could take the rate back to 19% by cutting spending, or raising taxes elsewhere. That would certainly be an intellectually coherent position to take (whether you agree with it or not), but it’s an argument that I don’t hear anyone making right now.
And, finally, you could argue that increasing the rate to 25% will actually bring in no more revenue, because profits will drop. The 25% is, the argument goes, past the “revenue maximising point”, and cutting back to 19% won’t actually cost anything. The problem is that there’s no evidence for “Laffer Curve” effects of this kind in the response to previous rate reductions.
So keeping the rate at 25% feels like the least bad of several bad ideas. I therefore unenthusiastically continue to support it.
-
1GDP data from the OECD tax database.
-
2p=0.54
-
3Source for GOS of all corporations is ONS data here, for GOS of oil/gas is ONS data here, historic CT data from the IFS and most recent data from HMRC here
-
4This is for two reasons: it is taxed differently, the oil/gas price is subject to significant fluctuations, and the tax regime has changed frequently – if therefore doesn’t tell us anything about normal corporate tax. I’ve also excluded the energy profits levy for the same reason. I’ve included the bank surcharge, because it’s just a higher rate of corporation tax for banks. I’ve excluded the bank levy, because it’s not a tax on profit. I’ve also excluded the residential property developer tax, largely because I’m unfamiliar with the detail – however the numbers are small (£157m in 2022)
-
5One big caveat: GOS is not the same as accounting profit, and in particular excludes depreciation (so the accounting profit will (all things being equal) be lower and the chart therefore understates ETR). So the trend is a useful indicator, but that absolute number cannot be compared with actual tax rates. Note that ONS CT receipts data now takes account of the time-lag between economic activity and tax payment (which has changed several times).
-
6Another factor we can dismiss is the wave of incorporation by small businesses. That artificially inflated corporation tax revenues, but at the cost of (greater) reductions in income tax. The effect, however, is too small to impact the trends visible in the charts above, being around £1bn (there was a much larger reduction in income tax revenues, because people were essentially avoiding income tax and opting into a significantly smaller amount of corporation tax). That pushed the apparent ETR up by approximately 0.2% – not material.
-
7Some of this was the crackdown on avoidance, but technical changes were more significant, particularly the abolition of industrial buildings allowance
-
8Another hypothesis that’s often suggested is that what’s been happening is profit-shifting by corporations outside the UK, so that GOS has disappeared from the national accounts. Hence, whilst that profit then isn’t (much) taxed, it doesn’t impact on this chart. Only the mugs that have stayed behind are paying the high rate. This is absolutely a real effect, albeit that real and forthcoming changes make it more difficult. However the evidence is that the UK is a net beneficiary of profit-shifting, so this effect does not explain the trend in the chart.
-
9We do have “full expensing” – enhanced relief for investment. There are good grounds to believe that permanent full expensing would materially boost investment; however this is a short term measure that is unlikely to have such effects. Most likely it functions (in essence) as a tax reduction for businesses making investments that were already planned before the policy was announced. It does therefore somewhat reduce the tax base. I missed this point in the original draft of this article – thanks to Chris Giles for spotting my error
-
10This is a simple projection which assumes the 2022 GOS nominal figures go up with inflation (which itself won’t change the ETR), and then adds in the effect of the increased rate: in other words, increasing the overall onshore CT take by 25/19, leaving offshore CT untouched, and reducing the bank surcharge to 3/8ths of where it was. It deducts the HMT projected cost of “full expensing” (from page 77 of the Budget Red Book. I make no attempt to take account of dynamic effects, but I’m unconvinced anyone really knows what those will be.

3 responses to “UK companies are now paying more tax than at any point since the 1970s”
Thanks for this article – which came as a surprise to me since I started working in tax in the 1970’s when headline rate was 52% but ‘stock relief’ existed and 100% First Year Allowances applied to many investments in P&M. Are these the main reasons why the relation between GOS and accounting profits has apparently changed so much over the years? If not, could you give examples of what has been the cause?
And I thought that Columbia (final graph) may have a disintermediation problem because of the availability of certain local flora which has a lucrative export market. The unknown is how rigorously tax collection is enforced. In Europe, pre-bailout Greece might be a good example.
Interesting as usual.
PS. The CAPTCHA’s are becoming genuinely difficult. Soon they will be something *only* AI can do, which they already often can.
thanks – yes, Colombia is on the list of countries where all statistics need a large asterisk next to them.
I am really sorry about the CAPTCHAs. I have to do them myself occasionally when at a wifi hotspot, and I hate them. Sadly I haven’t found a better way that (1) I can make work and (2) stops the site being covered with viagra adverts