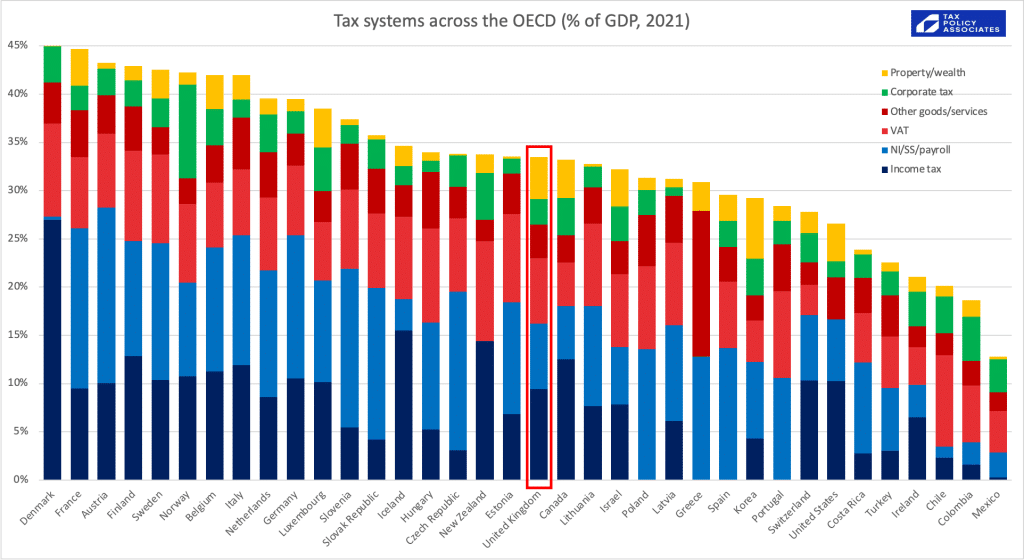
We now have the latest OECD tax data, showing tax as a percentage of GDP across the developed world.
The UK looks rather average:
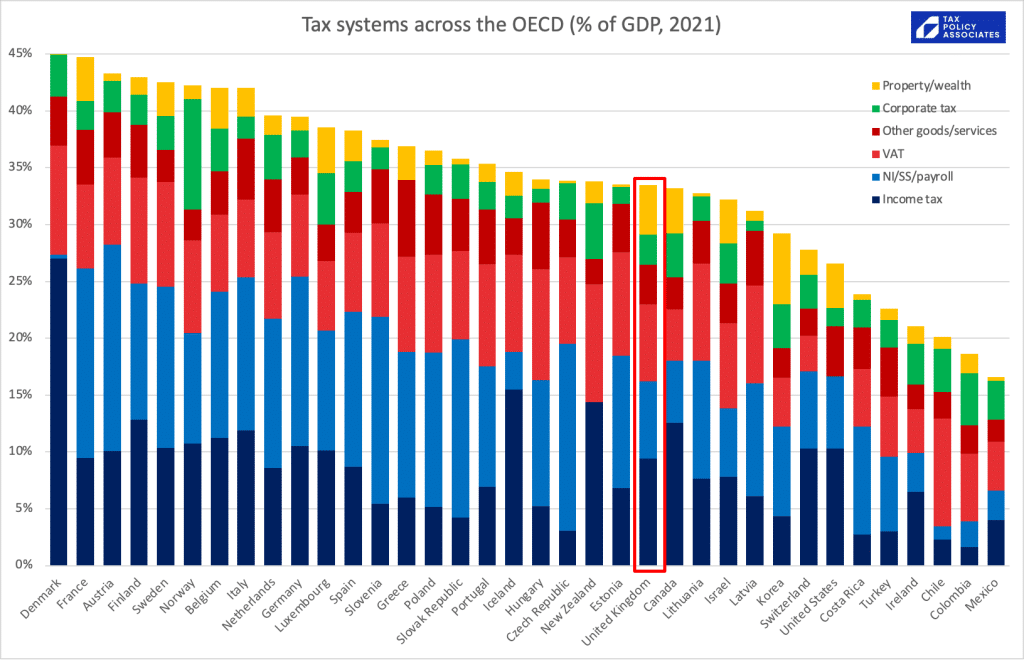
If we order by personal tax (income tax and national insurance etc), we see that UK income tax/NI is a somewhat lower % of GDP than average:
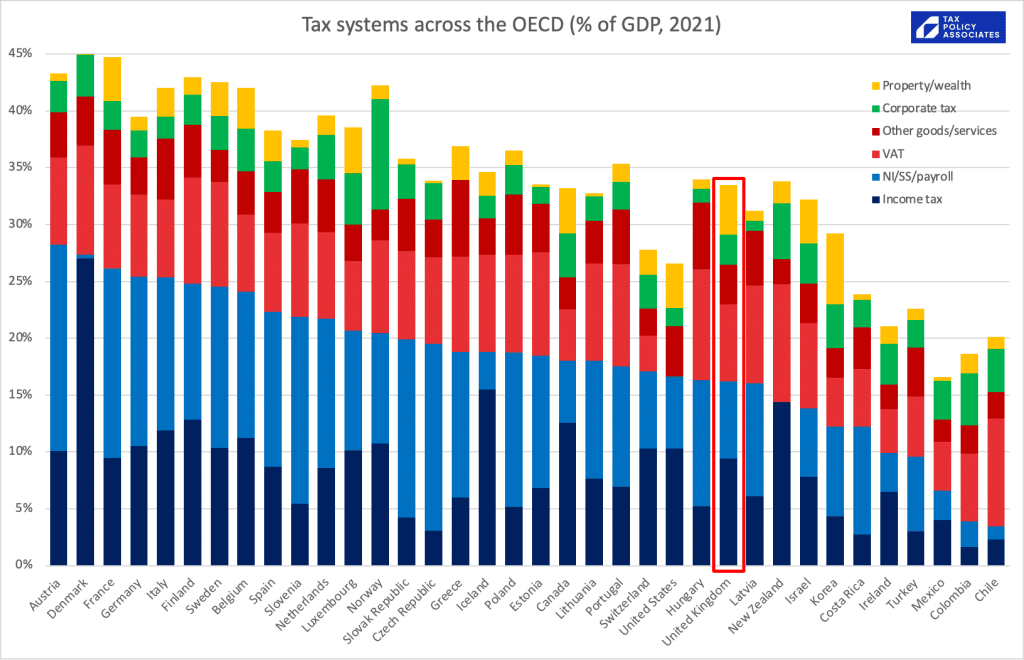
If we order by property/wealth tax, the UK surprisingly raises one of the highest %s of GDP in the world (although we should be careful about comparisons here; please see caveats below):
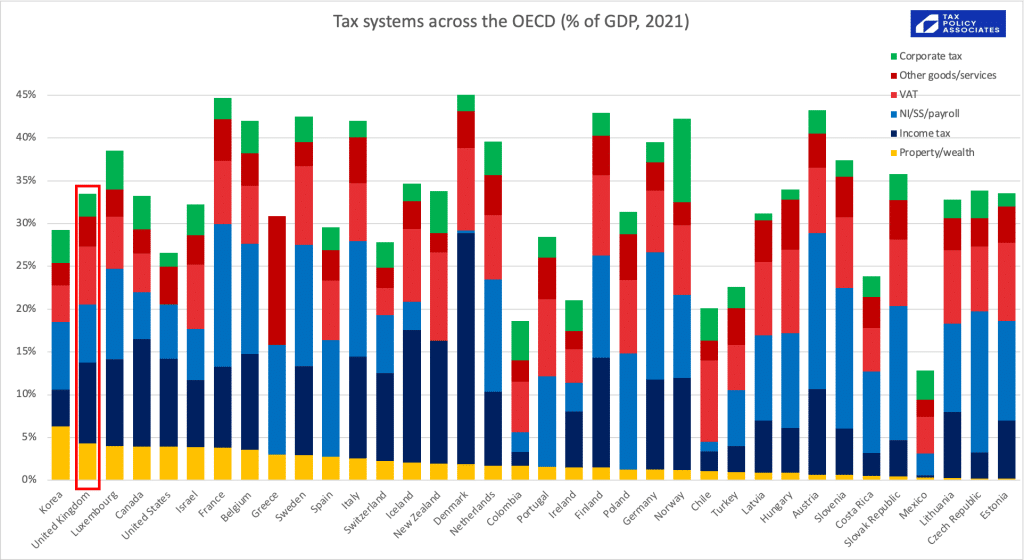
Corporate tax, the UK raises a bit less than average (although this is before the increase from 19% to 25%, which will put the UK in the top quartile):
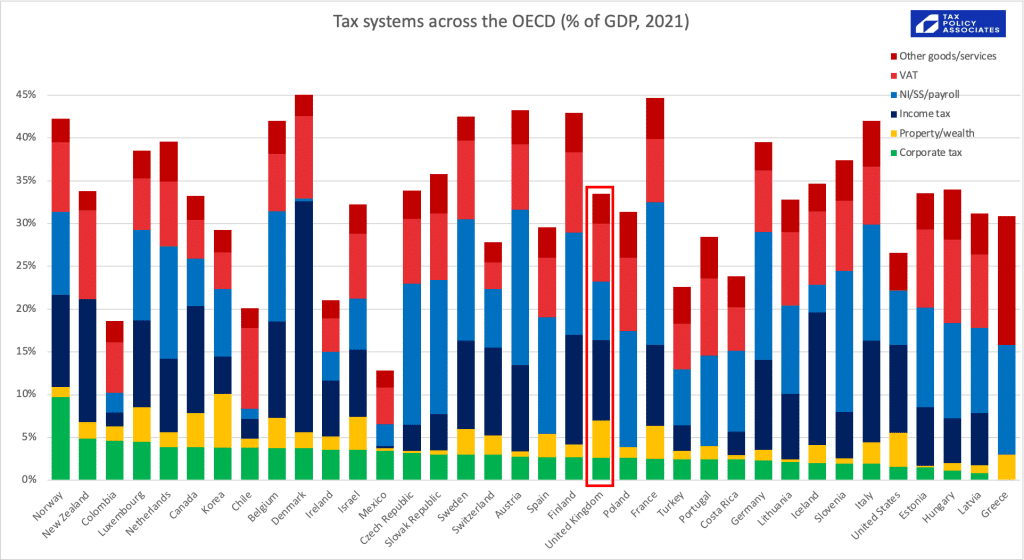
Another way to look at the data is each tax as a % of overall tax revenues. Then the UK looks rather unexceptional, raising proportionately a bit less in personal tax than most of the world, but a bit more in property tax.
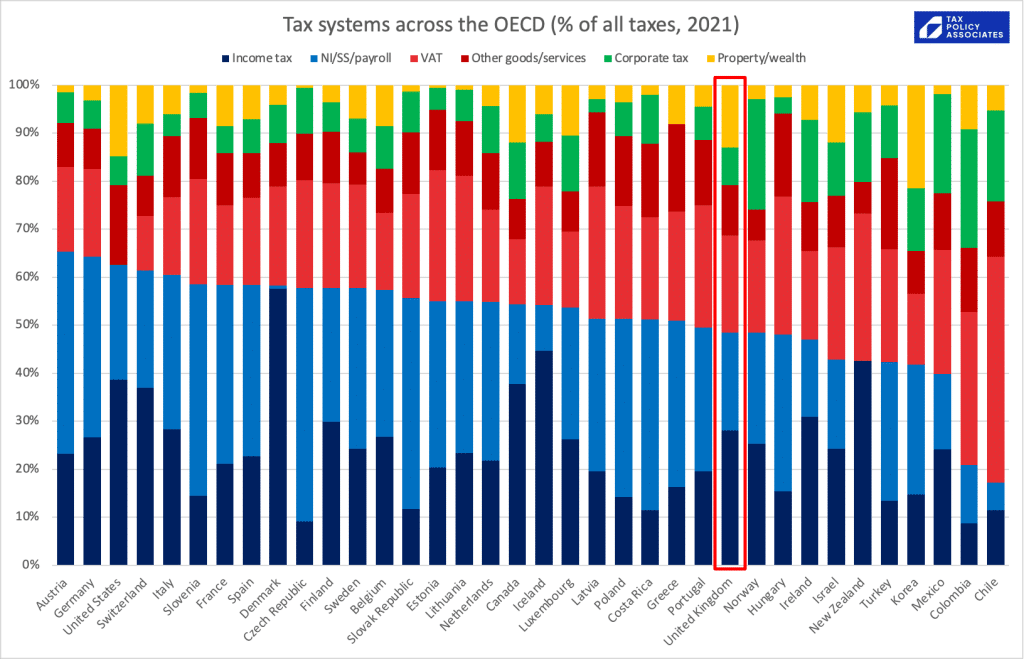
So many of the loudest voices in the tax debate are wrong. The UK is not horribly over-taxed. Wealth in the UK is not horribly under-taxed. We have a pretty typical tax system. We could tax a bit more, or tax a bit less, and there are certainly plenty of aspects of the system we could and should improve. But the case for revolutionary change often relies upon an inaccurate picture of how things are now.
The data is from the wonderful OECD global revenue statistics database – all I’ve done is take the many different taxes and push them into categories. The spreadsheet is available here.
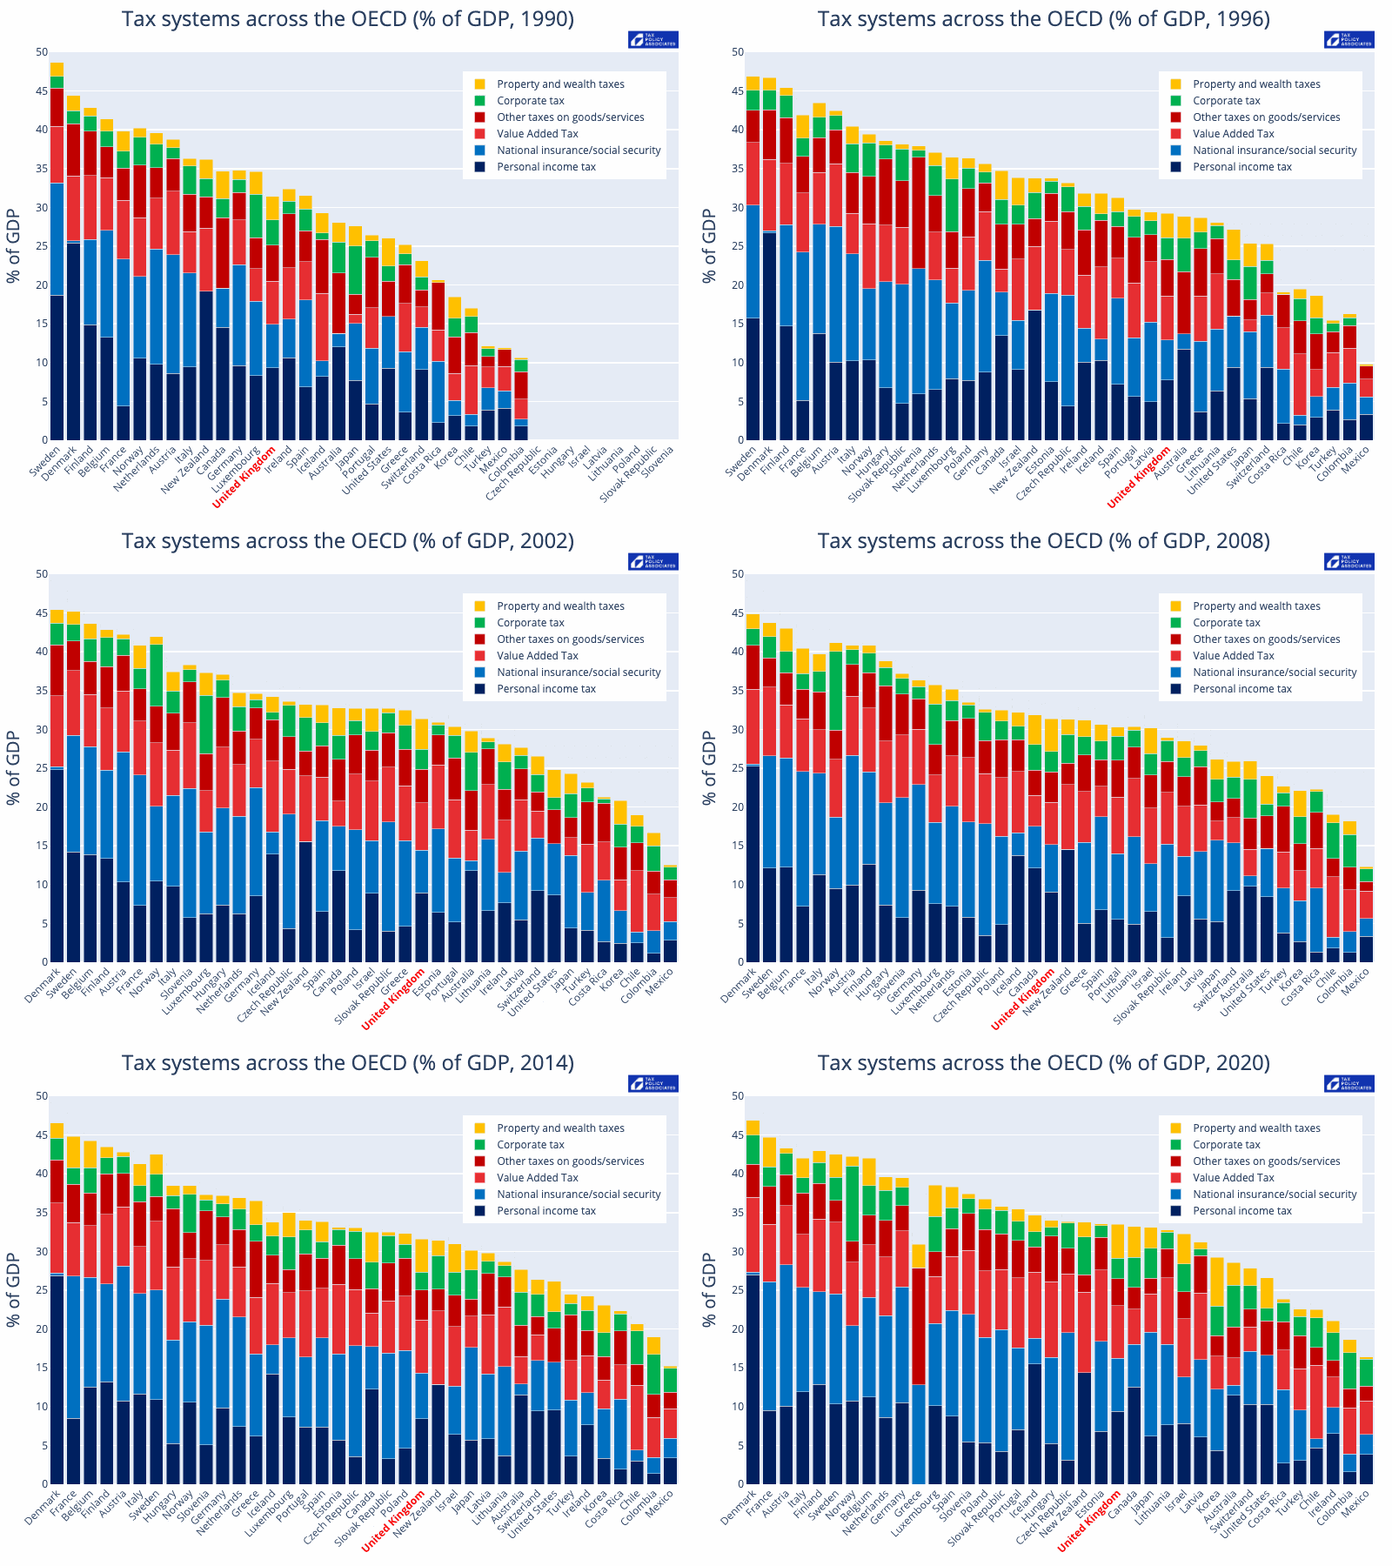
How’s it changed over time?
Like this:
Or, for the non-OECD countries:
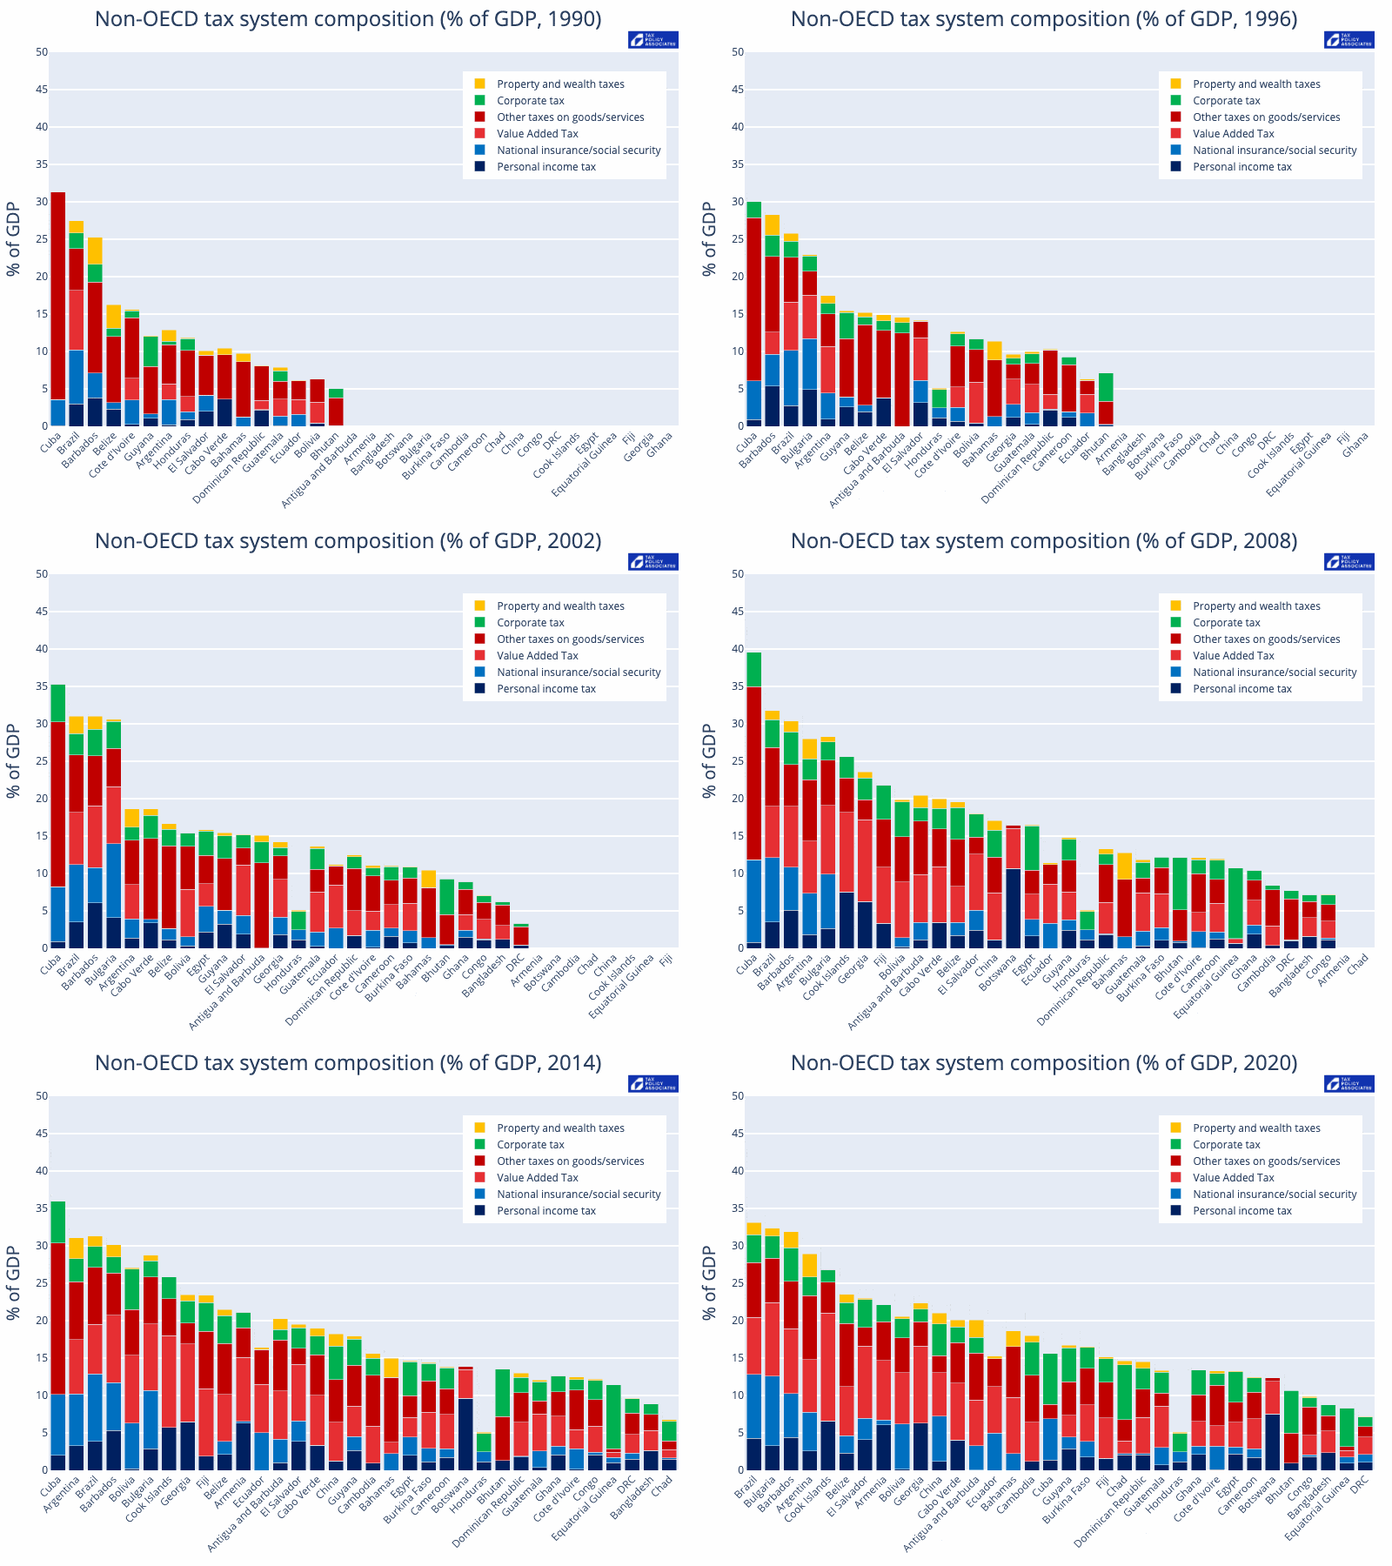
The code that generated these is available here.
Caveats
There are, inevitably, plenty of caveats:
- These figures include all national, state, local taxes.
- This is OECD data, and so (whilst I’m not certain) I don’t believe it will pick up the significant recent UK corrections. There may be similar data issues with other countries.
- It’s OECD only, so no Singapore (not an OECD member because it’s not a democracy).
- “Property/wealth” is a combination of capital gains tax, inheritance tax, stamp duty/land transfer taxes, council tax, and other recurrent and transaction taxes on property. This won’t quite be an apples-to-apples comparison, because property taxes in some countries pay for services which in other countries you pay for privately (e.g. garbage collection).
- “NI/SS/payroll” includes employee and employer taxes (because the economic burden ultimately falls on employees). Also includes such things as the UK apprenticeship levy. Comparisons need to be done with care because some countries have greater private pension provision, and others achieve an economically similar result with income-linked state pensions.
- Oil/gas taxation is included in “corporate tax”. You could argue it shouldn’t be; the inclusion is less a point of principle, and more because disentangling it from this dataset is hard.
- Small countries like The Netherlands, Luxembourg and Ireland (some would say “tax havens”) somewhat distort the data. Their corporate tax looks high; their GDP (particularly in the case of Ireland) is artificially inflated, so the overall level of tax looks low.
- Mexico, Colombia and Chile suffer from a large informal economy and so their personal tax revenues are relatively low, and they are disproportionately dependent on corporate tax and indirect taxes.
- Plenty of other factors complicating simple comparisons between countries, e.g. US private healthcare provision being economically akin to taxation but not showing in this dataset.
- A few countries haven’t provided recent data yet – Australia, I’m looking at you – and so are missing from the first charts. The animated chart replaces missing data with the previous year (to avoid it looking like the country has disappeared).
- GDP data is frequently subject to revisions, both corrections and changes in methodology. The OECD has kindly confirmed that the data we use here reflects all these revisions, and so it is appropriate to e.g. compare the 2021 GDP figures with the 1990 GDP figures.

8 responses to “Is the UK over-taxed or under-taxed?”
When it comes to understanding the proportion of GDP raised in tax, is any adjustment made/possible/useful for key elements of GDP that in some countries are funded by tax and in others privately? I’m thinking of healthcare which in the UK is mostly funded by tax but in many other countries is funded by private insurance.
Perhaps someone could do that, but it would be hard…
Matt makes an excellent point, “…the median taxpayer in the UK pays extremely little income tax relative to other European countries whilst the top decile of earners pay far more comparable (still slightly lower) amounts than their European peers. This is not the standard narrative in political debate.”
This is under-appreciated, I think. There’s a unpleasant implication for the sustainability* of the UK budget in this respect, as the people who are the most highly-taxed are also the most mobile: largely professional services workers in London and SE England. This is something which, if the UK were competently managed as we do for projects and programmes, would be high on the RAG (Red Amber Green) status list as both (i) high likelihood; and (ii) high impact if such earners decline to continue to participate, and instead retire early, go part-time or emigrate.
Without criticism Dan, I think the charts above are insufficiently clear on this point. To adequately assess the issue, I suspect that comparisons would need to be made of people earning, e.g. £100k, £125k, £150k, £200k in various jurisdictions. Despite appearances, they are not particularly high salaries for sections of the London workforce. E.g. all senior associates in major US law firms are on over £200k base salary, let alone bonuses.
(* My, now somewhat dated figures, were: “The top 16% already pay 67% of all income tax and overall the top 1% pay almost 30% of income tax. 60% of income tax is now paid by 10% of taxpayers with 95% of those working in the private sector…” https://london2050.wixsite.com/miscellaneous-musing/post/uk-prognosis)
thanks – that’s a good point. I’d love to do a proper comparison of the tax position of high earners – the difficulty is that the UK is relatively unusual in having a straightforward outcome with very few deductions (aside from pension contributions, VCTs etc). In e.g. France I understand that many high earners actually pay a much lower effective rate. So if I just plotted the tax bands I fear that would be misleading. Better to, for example, have stripes rather than lines, showing the base case effective rate and the realistic best case if all deductions are claimed.
In the longer term it’s perhaps a project I could undertake jointly with French, German tax people?
But I agree with Matt’s point: both the factual claim and the point about the narrative.
So Denmark is the only country which is honest about income tax (not disguising it as social security)?
Poland, Greece, Spain, and Portugal do have personal income tax – is it really close to zero as a proportion of GDP?
In Poland the employee tax wedge is more or less a flat 35%, but starts all Social Security and becomes nearly all income tax at higher levels.
I wonder whether super-taxes (Poland has 4%) on income have been classified as wealth taxes when they are really income taxes?
The surprisingly high UK “wealth and property tax rate” is presumably due to SDLT, with recurrent property taxes being arguably distortingly low?
Thanks for the charts – great reading.
I was wondering, what is happening with Spain / Poland / Greece? The amount of Income Tax being paid appears to be zero – presumably the Income Tax is being classified as NI/SS/Payroll instead. Why is this?
My apologies – that was an error, now fixed.
If you squint there is really not much difference between the UK and other European countries. These international comparisons are indeed a very strong argument for being cautious about ‘silver bullet’ arguments from politicians. If we could magically solve things by doing X then why has no other country tried it?
The biggest difference I observe is that the median taxpayer in the UK pays extremely little income tax relative to other European countries whilst the top decile of earners pay far more comparable (still slightly lower) amounts than their European peers. This is not the standard narrative in political debate.
You have previously made a very strong argument for tax reforms i.e. collecting tax more sensibly without undesired distortions. I would argue that removing the tax-free allowances should form part of this (even if it is tax neutral because you give the same people the same amount back in benefits of some sort). If a large number of voters do not pay income tax and do not feel they have ‘skin in the game’ I do not see how you can expect them to weigh up the pros and cons of tax and spend policies at the ballot box.
Thanks for the great work, as always.